Analytics terminology can feel like its own language, full of words like “bounce rate,” “segmentation,” and “attribution” that get thrown around as if everyone already knows what they mean. Understanding these terms doesn’t require a data science background, just a plain-language breakdown of what each one actually means and why it matters.
we’ll go through the terms you’re most likely to run into as a beginner, grouped by what they’re generally used for.
Basic Data Terms
Data point: A single piece of information, like one customer’s purchase or one visit to your website.
Dataset: A collection of related data points grouped together, like all of last month’s sales records.
Metric: A specific number you track, like total sales, website visitors, or customer sign-ups.
KPI (Key Performance Indicator): A metric considered especially important for measuring success toward a specific goal, like monthly revenue or customer retention rate.
Dashboard: A visual display, usually a mix of charts and numbers, that summarizes key metrics at a glance without digging through raw data.
Website and Traffic Terms
Bounce rate: The percentage of visitors who leave your site after viewing just one page, without clicking anywhere else.
Conversion rate: The percentage of visitors who complete a desired action, like making a purchase or signing up for a newsletter.
Traffic source: Where your website visitors are coming from, such as search engines, social media, or direct visits.
Session: A single visit to your website, which may include multiple pages viewed before the visitor leaves.
Unique visitor: An individual person visiting your site, counted once regardless of how many times they visit within a given period.
If you want to go deeper on which of these numbers actually matter most for your business, our post on 6 key metrics to track for better business decision making is a good next step.
Segmentation and Targeting Terms
Segmentation: Breaking your data into smaller, more specific groups, like customers by age, location, or purchase history, so you can analyze each group separately.
Cohort: A group of users who share a common characteristic or experience within a defined time period, like everyone who signed up in the same month.
Persona: A representative profile of a typical customer type, built from data patterns, used to guide decisions around product or marketing.
Analysis Type Terms
Descriptive analytics: Analysis focused on summarizing what already happened, like total sales or website traffic over a given period.
Predictive analytics: Analysis that uses historical data to forecast what’s likely to happen next.
Attribution: Determining which marketing channel or touchpoint gets credit for driving a sale or conversion.
For a fuller breakdown of how these analysis types differ and where each one fits, our post on types of analytics explained covers descriptive, diagnostic, predictive, and prescriptive analytics in more detail.
Reporting and Visualization Terms
Data visualization: Turning raw numbers into charts, graphs, or maps that are easier to interpret at a glance than a spreadsheet full of figures.
Trend: A general direction data is moving over time, like steadily rising sales or a gradually declining bounce rate.
Benchmark: A reference point used to compare your performance, either against your own past results or against industry standards.
Good visualization matters more than people expect, since even accurate data can be misread if it’s presented poorly. Our roundup of the best data visualization tools covers platforms specifically built to make this part easier.
Technical Terms You’ll Run Into
API (Application Programming Interface): A way for different software systems to automatically share data with each other, often what powers integrations between your analytics platform and other tools.
Data pipeline: The automated process that moves data from its source into your analytics platform for processing and analysis.
Real-time data: Data that updates immediately as events happen, rather than being reported after a delay.
Machine learning: A method where software identifies patterns in data and improves its predictions or classifications over time, without being explicitly programmed for every scenario. It’s increasingly built into modern analytics platforms to power features like automated insights and anomaly detection, and our post on the top benefits of integrating AI with data analytics covers how that’s actually playing out in practice.
Quick Reference Table
| Term | Simple Definition |
|---|---|
| KPI | A metric considered especially important to a goal |
| Bounce rate | Percentage of visitors who leave after one page |
| Conversion rate | Percentage of visitors who complete a desired action |
| Segmentation | Breaking data into smaller, specific groups |
| Attribution | Crediting a channel for driving a sale or signup |
| Dashboard | A visual summary of key metrics |
Building on These Basics
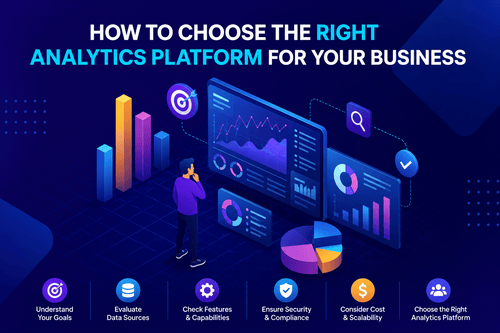
Once these terms feel familiar, the next step is usually picking a platform that actually fits your needs and skill level. Our guide on how to choose the right analytics platform for your business walks through exactly what to weigh before committing to a specific tool.
FAQs About Analytics Terms
What’s the difference between a metric and a KPI?
A metric is any number you track, while a KPI is a metric your business has specifically identified as important for measuring progress toward a goal.
What does bounce rate actually tell you?
It shows the percentage of visitors who leave your site after viewing only one page, which can indicate a mismatch between what visitors expected and what they found.
Is data visualization the same as a dashboard?
Not exactly. Data visualization refers to any chart or graph representing data, while a dashboard is a broader collection of visualizations and metrics displayed together in one place.
What is attribution in analytics?
It’s the process of determining which marketing channel or touchpoint should get credit for driving a specific sale or conversion, which helps businesses understand what’s actually working.
Do I need to understand machine learning to use an analytics platform?
No. Most platforms that use machine learning handle it in the background, surfacing insights or predictions without requiring you to understand the underlying technical process.
Why does segmentation matter?
Looking at data as one big group can hide important differences. Segmentation lets you see how specific groups, like new customers versus returning ones, actually behave differently.